Methods
Introduction
As described in our design process page, we decided that we should test our riboswitch designs in vitro as ssDNA molecular beacons. It is challenging to precisely control and accurately measure the concentration of chemicals inside cells because of the host cell's metabolism, compartmentation and issues with lack of transparency and permeability. In order to characterise our design and determine whether it is capable of cooperative conformational change, we first examined the structure in vitro where we can more accurately control the concentration of each component as well as the ability to alter temperature and buffer conditions.
Testing in vitro however means that we must rely on the structural interpretations of biophysical data, such as mobility on a gel and FRET measurements. These are only models for our desired outcome: the translation rate of an mRNA containing our switch structure.
To investigate our switches in vitro we aimed to answer the following questions, optimising our procedures at each phase, before continuing:
-
Can we anneal the strands of our switches?
-
Can we assemble our switch?
-
Can we detect the fluorescence of our fluorophore-labelled oligo? What are the sensitivity/signal to noise limits? What concentration should we test our switches at?
-
Can we observe a structural change in our switches upon addition of our triggers?
-
Can we observe fluorescence changes upon addition of trigger to our switches?
-
Are our switches opening/closing cooperatively?
This list was applied to both our activatory and repressive designs. To answer these questions we used the following techniques:
-
Native Polyacrylamide Gel Electrophoresis (PAGE)
-
Fluorescence Quenching (FRET) between flourophore and quencher-labelled oligos
-
Thermal cycle annealing
The principles behind each of these techniques are summarised below. For the results of these techniques applied to all of our switch designs and our interpretation of these results please see our activatory and repressive results pages.
Have you ever seen a jellyfish that is able to glow in the dark? Was it not just beautiful? These fish contain special proteins (such as Green Fluorescent Protein, i.e. GFP) that allow them to glow. How does this protein achieve to create such a magnificent effect and how does that apply to our analysis?
Well, it is due to a physical phenomenon called fluorescence. This phenomenon arises when an orbital electron of an atom or a molecule, called a fluorophore, is excited by a photon of light then relaxes to its ground, lowest energy state.
During relaxation, the electron emits a photon with an energy (which is related to wavelength) equivalent to the energy difference between the two states. This an inverse relationship, i.e. Higher energy means a lower wavelength. In case of fluorescence, the energy or wavelength of the photon is in the visible spectrum and can be seen by the human eye. Different fluorophore are excited and emit at different wavelength e.g. GFP and our reporter mKate2.
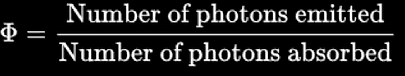
However, not every relaxation results directly into fluorescence. There are other mechanisms of relaxation (e.g. vibrational relaxation). The ability of a fluorophore to fluoresce can be described by a so called quantum yield, which is defined as the proportion of absorbed photons re-emitted as light.
The quantum yield depends on many factors surrounding the fluorophore, such as temperature, pH or presence of special molecules called quenchers. Quenchers are molecules that decrease the quantum yield of a given fluorophore when they are in close proximity. Therefore, presence of a quencher near a fluorophore will greatly decrease the intensity of emitted light.
There are various mechanisms of quenching, but we will focus on FRET (Förster resonance energy transfer) mechanism, as it occurs in our case. This type of quenching arises as a result of dipole-dipole interactions. The strength of the interaction depends on the relative distance and orientation of each dipole. The closer the dipoles are, the greater the stronger the interaction and the more efficient the FRET transfer.
In the case of quenching, the closer the Fluorophore dipole is to the Quencher molecule, the stronger the quenching. Therefore, the proximity of the Fluorophore - Quencher pair indicates the relative distance in space and changes in FI can be used to probe structural changes and rearrangements.
For our experiments we used the fluorophore FAM and quencher BHQ. The fluorescence signal output depends upon the distance between them which is consequence of the structure of our switches. For more information see our design page.
In our plate reader experiments we made up a solution with equimolar switch, 5' fluorophore-labeled oligo and 3' quencher-labeled oligo in 2x buffer and a serial dilution of our trigger strand in water. 50ul of the Switch-Fluorophore-Quencher solution was put into each well of our plate along with 50ul of trigger solution.
Thermal cycle annealing
We used this technique to explore the energetic landscape of our switch assembly.
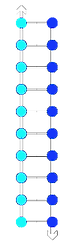
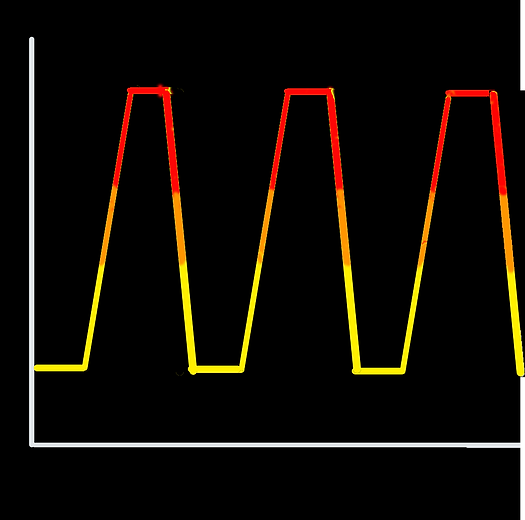
This technique enables denaturing and unfolding of a macromolecular complex, which is followed by refolding. Heating the sample causes non-covalent intermolecular bonds to break and thus denaturation. Cooling of the system allows the bonds to be reformed and this leads to refolding of the molecules within the sample. We used this temperature profile:
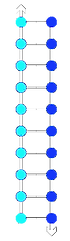
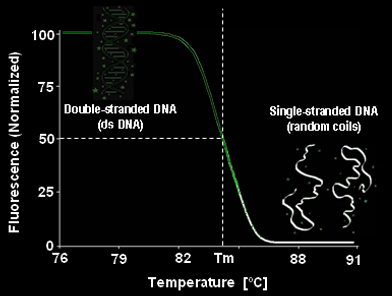
The main non-convalent interactions involved in DNA bonding are hydrogen bonds between bases, as well as π-stacking interactions of adjacent bases. Adding energy to the system by increasing the temperature breaks these interactions in a cooperative manner. As more intermolecular bonds are broken, the more unstable the other bonds become, giving a cooperative denaturation curve. The temperature at which the 'switch' from double-stranded to single-stranded DNA happens is known as the melting temperature (Tm).
This gives us an idea about the species present in the sample and its stability, as different DNA sequences and therefore complexes will have different Tm. In simple terms, the stability of each DNA duplex depends on the complementarity of the two strands. Strands with high complementarity will have a high number of favourable base pair interactions. Some base mismatches can be tolerated if there is a large enough number of favourable base pairs formed. The more favourable the DNA duplex structure is, the higher the Tm and vice versa.
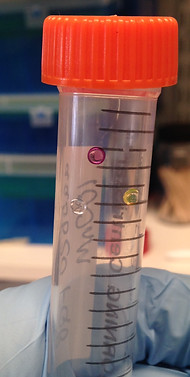
In our case, we added Sybr Green into the samples to probe changes in the DNA structure, specifically the double-stranded DNA (dsDNA) content. Sybr Green is a fluorophore that binds double stranded DNA by interchelating between the base pairs, much like other dsDNA dyes, e.g. Ethidium Bromide. The resulting complex then absorbs blue light (497 nm) and emits green light (520 nm). Double stranded DNA is labelled much more efficiently by Sybr Green, compared to single stranded DNA. Therefore, at room temperature, the sample with most dsDNA character will emit high intensity of green light upon excitation. However, as the dsDNA character of the sample decreases with increasing temperature due to double helix melting, the Sybr Green labelling becomes less efficient and the fluorescence intensity decreases:
A qPCR machine can be used to simultaneously cycle through a predefined temperature 'landscape' and also monitor the fluorescence intensity output and hence quantify the dsDNA/ssDNA content in the sample at any given temperature.
Quenching
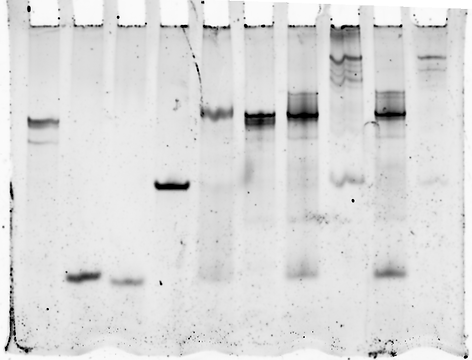
Native Polyacrylamide Gel Electrophoresis
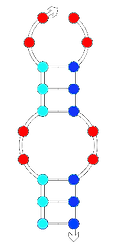
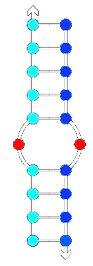
We used polyacrylamide gel electrophoresis (PAGE) to verify proper switch assembly and also to observe changes in secondary structure. This is an analytical method for separation of macromolecules (DNA, in our case) based on their mobility in non-denaturing, i.e. native, conditions where the strands can anneal together. Mobility is a function of the molecules' size, charge and shape.
Negatively charged nucleic acid fragments loaded into a gel well are exposed to an electric field and migrate away from the negative end towards the positive end of the field. The migrating molecules are impeded by the porous gel matrix that acts like a 'sieve'. Smaller and more compact fragments are able to squeeze through the pores much more easily than larger, more diffused fragments. This results in smaller fragments being able to travel faster and further than larger fragments. Therefore, over a certain period of time, the fragments will be separated according to their relative mobility. Due to the chemical nature of DNA, the charge/size ratio is the same for all fragments and thus charge does not contribute to the separation.
In addition to size, native PAGE is used to analyse the secondary structures of nucleic acids, since the different secondary structure affect mobility. As mentioned before, more compact secondary structures will travel faster through the porous matrix, compared to more diffused structures that will struggle to fit through the pores.
We are able to stain or label the DNA fragments which will appear as 'bands' on the gel, where each band represents a population of fragments with the same size and mobility. Any structure containing our 5' FAM fluorophore-labelled oligo or "mimic" oligo will appear as a flourescent band without staining. Structures without these labels can be stained using SYBR gold, a fluorescent DNA binding dye, so that they then show up on the gel scanner.
We can assess the mobility of individual bands based on the relative distance they have travelled from their start position in the wells.
Multiple samples can be run in parallel lanes. Each lane can be loaded with a different sample composition or with samples that were treated differently. Therefore, each lane will give a unique pattern of bands, based on the sample composition. This allows direct comparison between the samples.
The binding of triggers to our switches can create structures that differ in both size and shape as the switch change its folding and gains mass of the trigger. We can alter the gel conditions, e.g. acrylamide percentage (4-15%), Voltage (120V-200V), buffer or run-time, in order to achieve better resolution of these structures.
Heavier and less compact structures
Lighter and more compact structures
+
-


Emitted light
Excitation light
GFP
Fluorophore
Fluorophore
Switch
Trigger dilutions
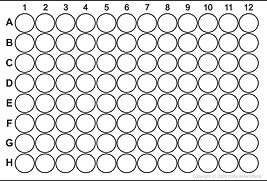
96 well plate
50ul
50ul
Switch solution with 2x Buffer
Measure in Plate Reader


Cooling
Strands Anneal
Heating
Strands Melt
dsDNA
ssDNA
Low complementarity
Lower Tm
High complementarity
Higher Tm
Temperature
25°C
95°C
Change by 1°C every 12sec in heating/cooling stages